We generate weekly insights from your GA4 and Search Console data
No credit card needed to get started

Trusted by growing marketing teams and solo founders


Users, sessions, conversions, events
Clicks, impressions, click-through rate, position
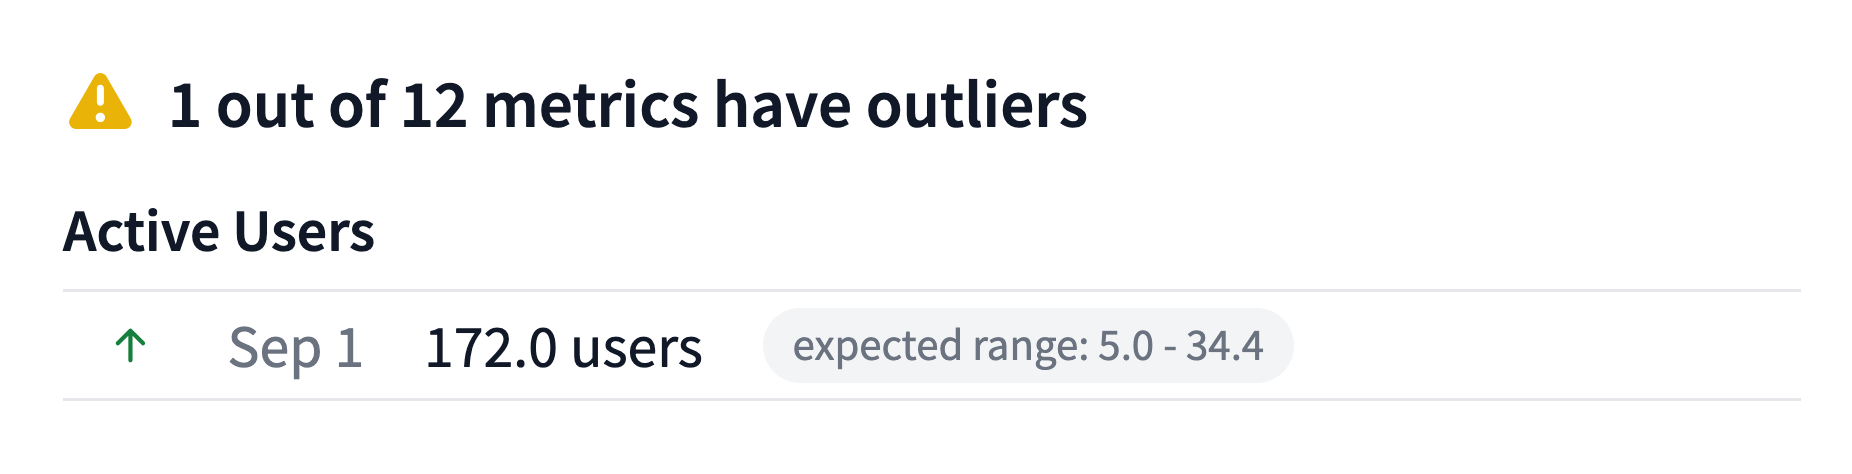
WebTrafficWatch automatically flags unusual values in your metrics each week. We build a custom linear model from historic data for each of your time series, compare the last 7 days to expected values, and detect any significant deviations. If something looks off, you'll know.

Website traffic patterns often differ between business days and weekends. Our models account for that by treating them separately - so you get cleaner insights and more accurate trends.
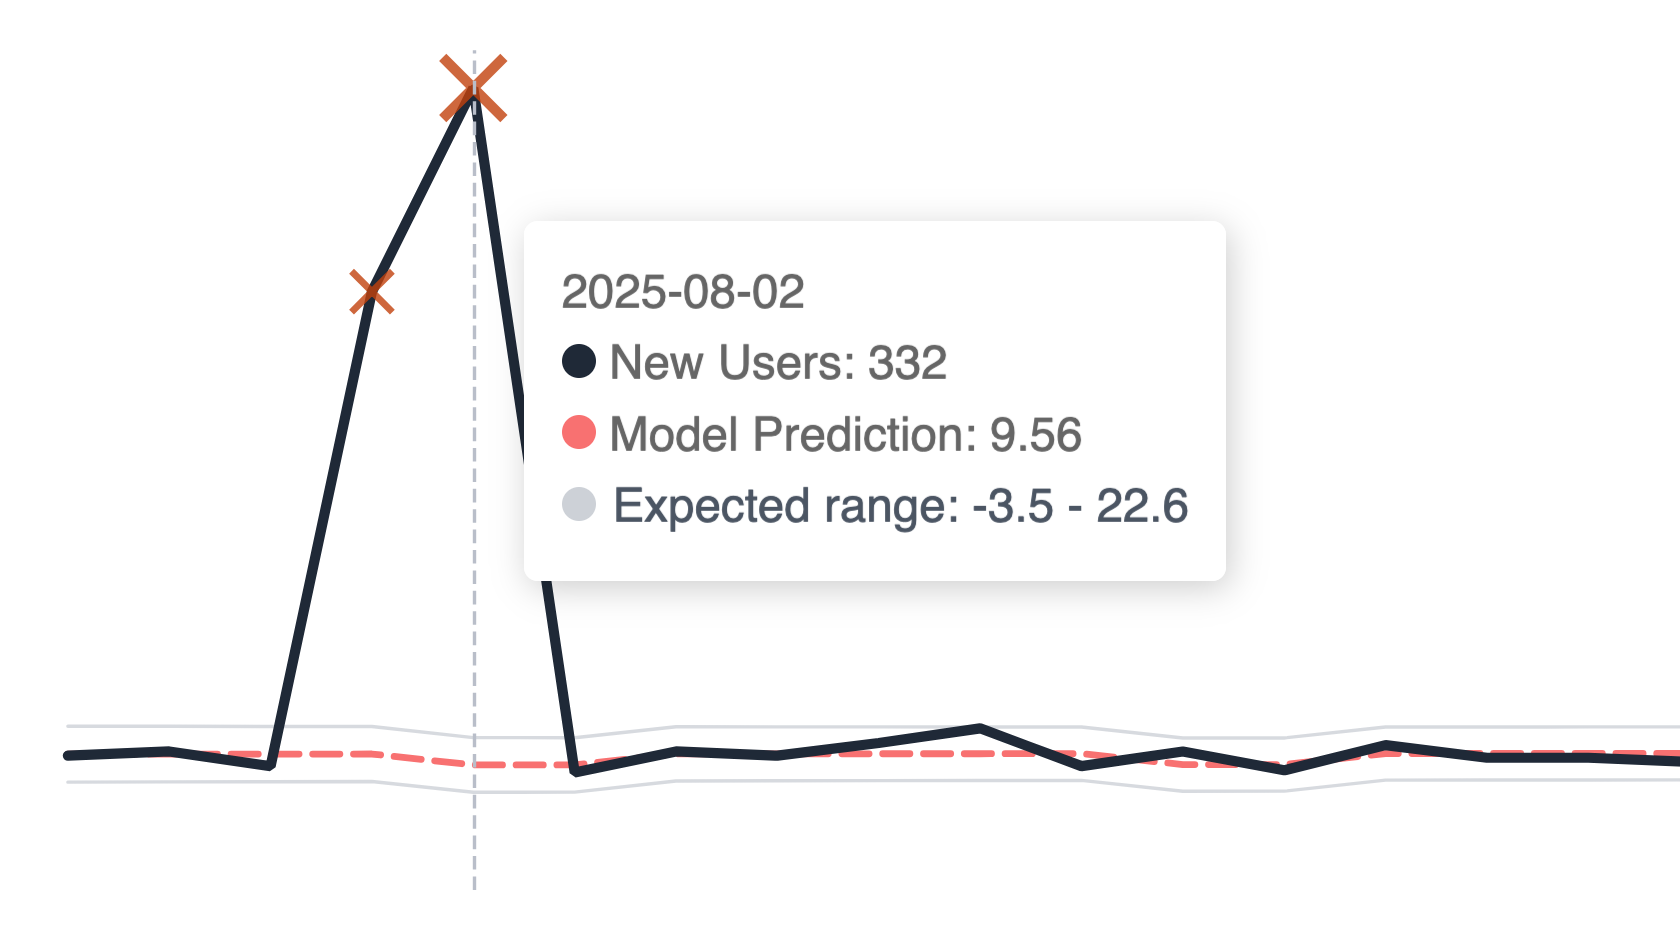
One viral spike (maybe from your Product Hunt launch) can ruin your trend line and skew it heavily. We clean your data before fitting a model by removing outliers like launch-day traffic. You'll see the real trend, not noise.

Each week, we compare recent performance to your historical trend. If anything falls outside the expected range, we list it in the weekly report.
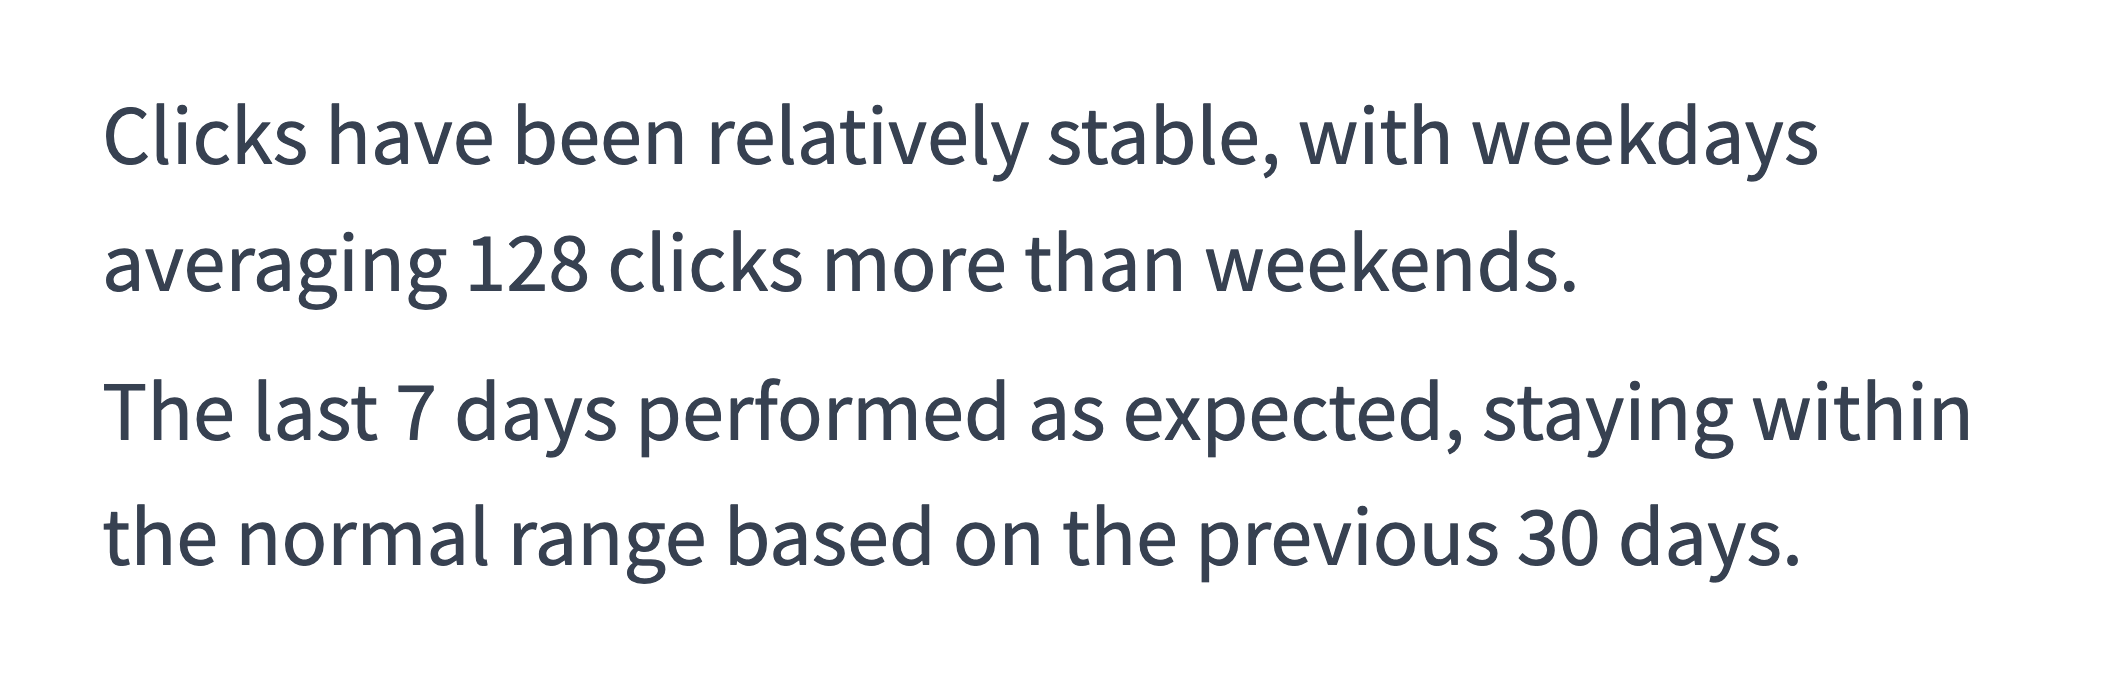
You don't need a stats degree to understand our reports. We explain every insight in clear, simple language. Because everyone needs to understand what's going on with your metrics.
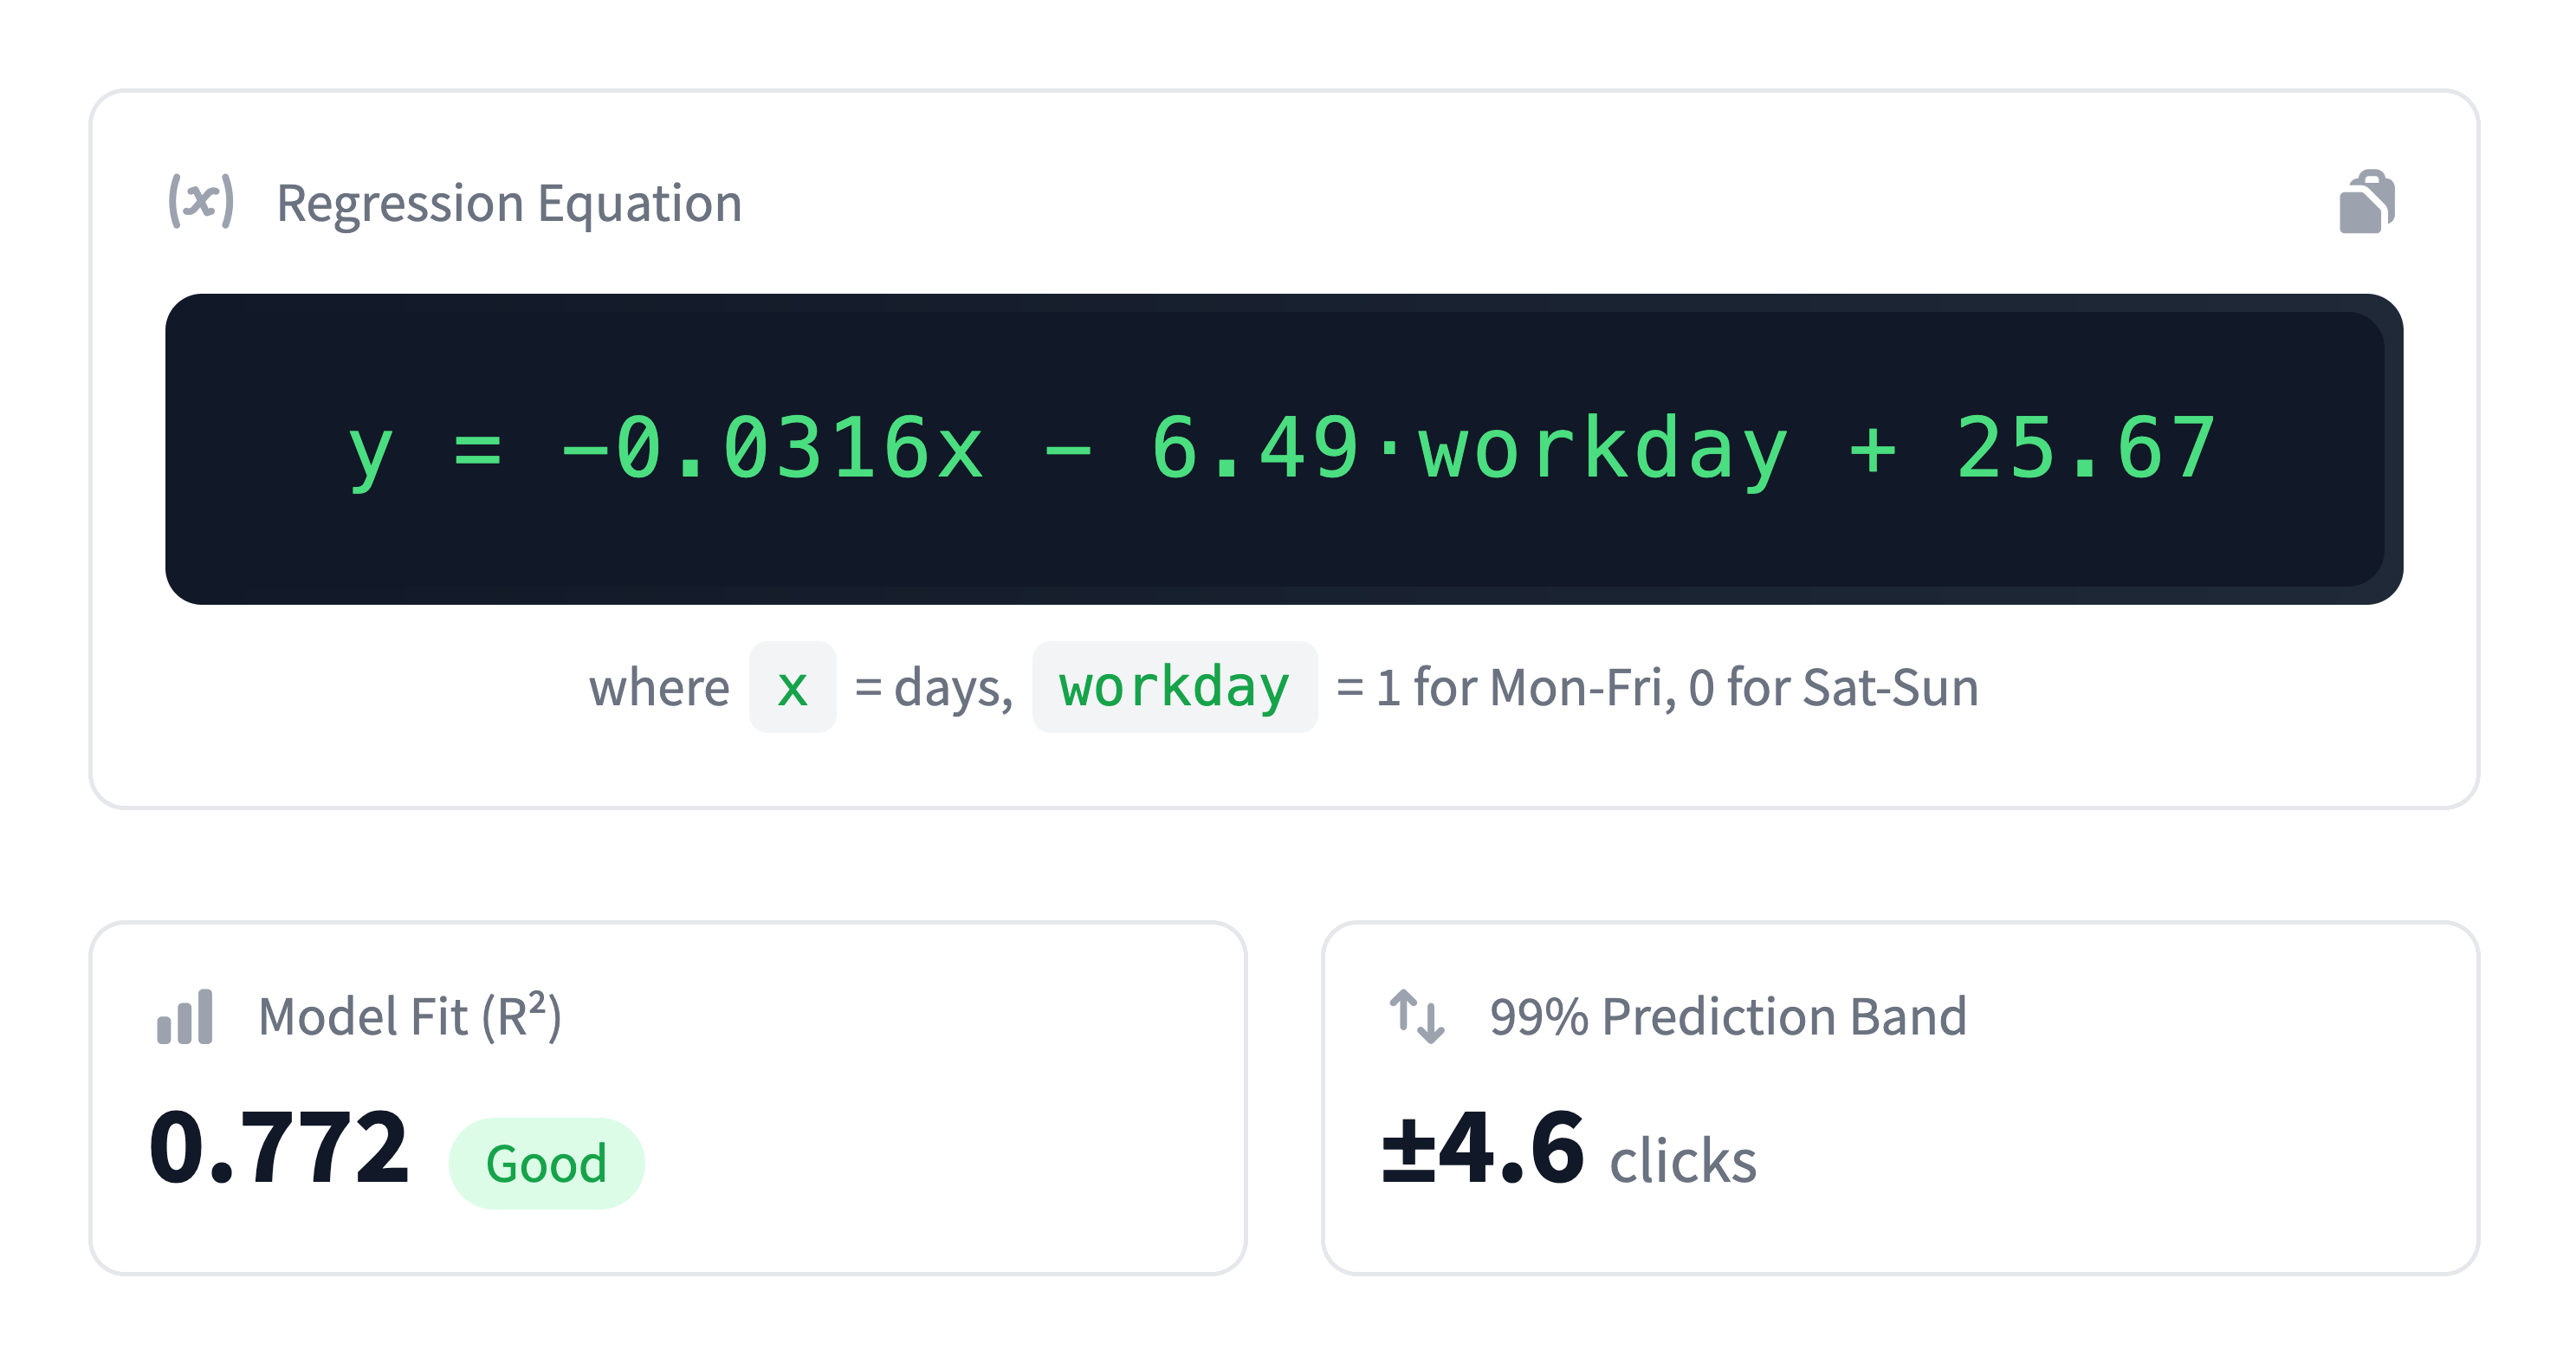
But, if you want the technicals, we've got them. See the regression equation, R² value, and confidence intervals for each model.
WebTrafficWatch acts like a lightweight data science layer on your analytics, automatically answering: "Did something unusual happen last week?"
Link your Google Analytics 4 and Search Console account. Select the metrics you want WebTrafficWatch to track.
WebTrafficWatch cleans your data to remove outliers like traffic spikes. It then builds linear models to identify trends and patterns.
Get a weekly email summary highlighting anomalies, plus a dashboard with trend explanations, confidence bands, and detected outliers - all in plain English.
Read the full article: How WebTrafficWatch Works
Connect in under 2 minutes with your Google account.
No credit card needed to get started
