WebTrafficWatch turns your GA4 and Search Console data into actionable insights - without any manual analysis. Here’s exactly how the system works, from data import to anomaly alerts.
Once you connect your Google Analytics 4 or Google Search Console accounts (or both), WebTrafficWatch begins importing the metrics you've selected. From now on it'll import those metrics every day.
We import daily aggregates for the following metrics:
You select which of these metrics you want us to track. The rest is fully automated.
Data is imported and kept at daily resolution. This gives us a great compromise between preserving daily fluctuations, but smoothing out hourly noise.
Linear regression is sensitive to outliers like the spike in traffic you get after a Product Hunt launch or a viral tweet. Instead of letting those events distort your trend lines, we use RANSAC (RANdom SAmple Consensus) to fit a linear model.
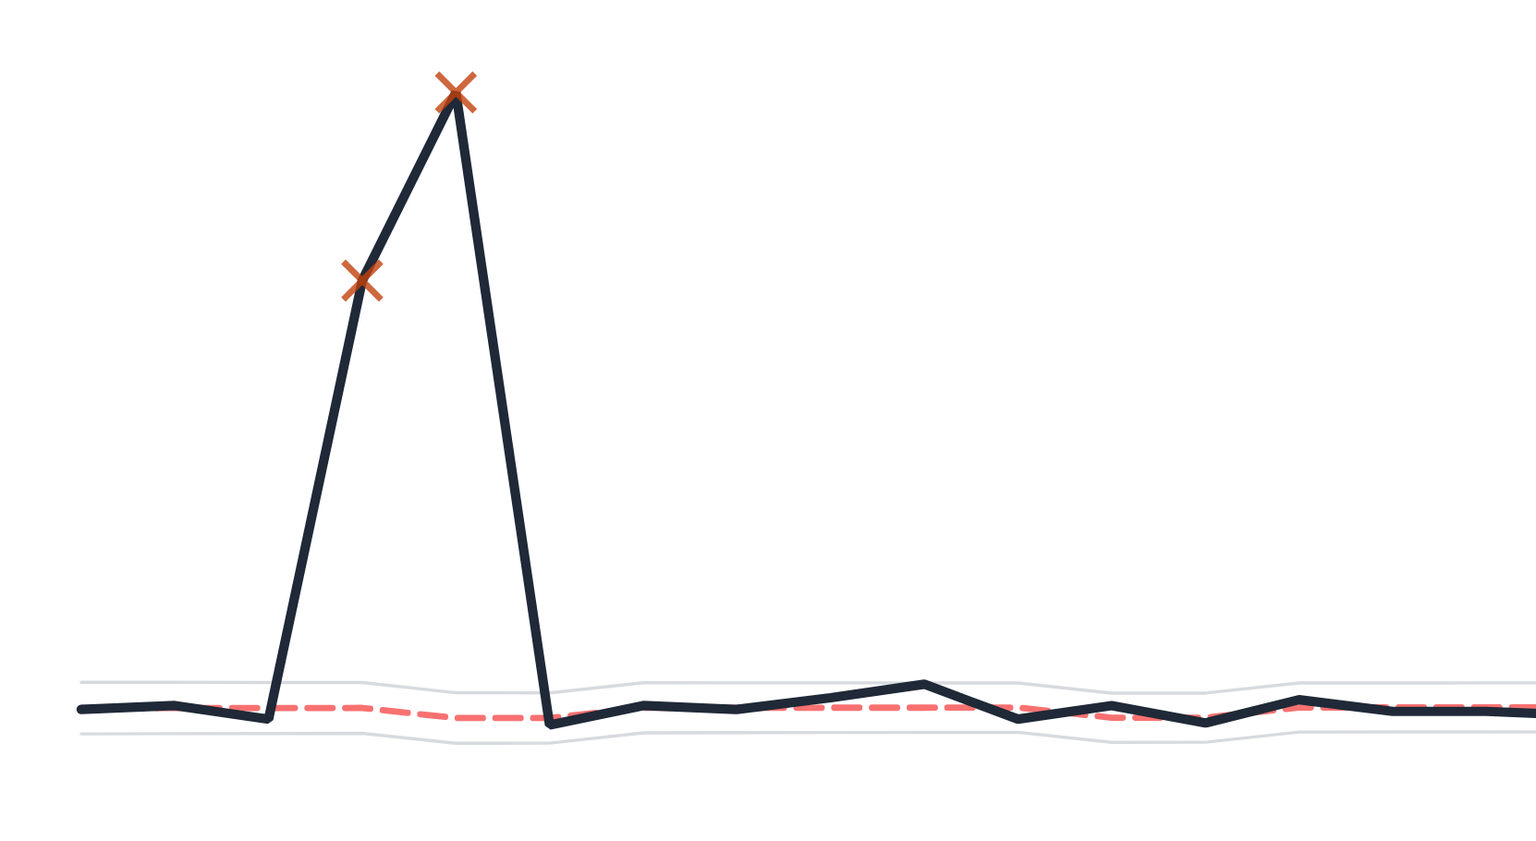
RANSAC iteratively fits regression models and excludes data points that don’t conform to the majority trend - whether they're upward or downward spikes. This gives us a clean foundation for modeling real behavior, not noise.
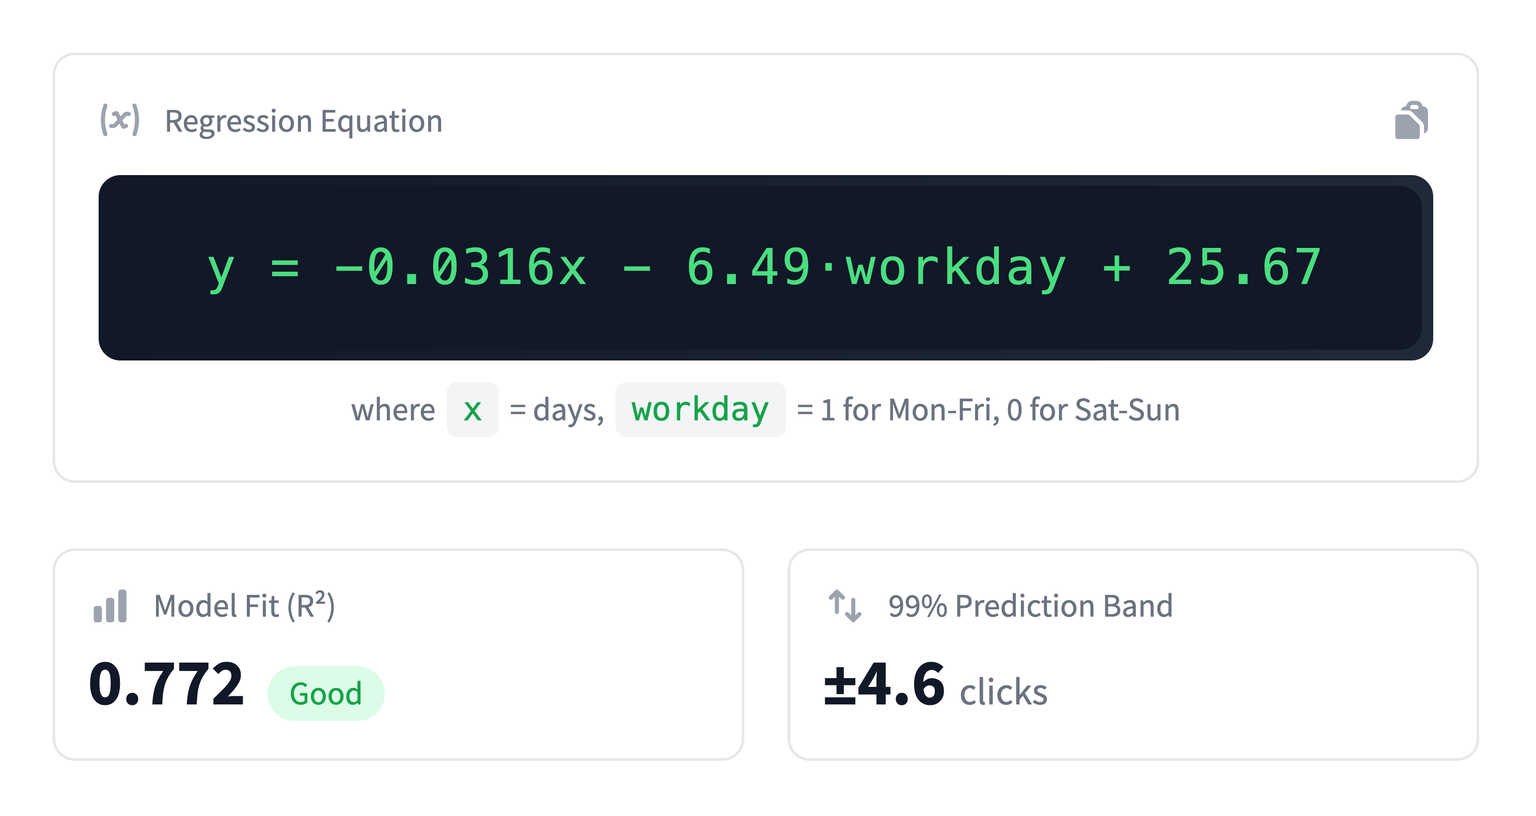
For each selected metric, we fit a linear regression model using Ordinary Least Squares (OLS).
To account for behavioral differences between weekdays and weekends, we include a categorical variable that distinguishes between the two. This allows the model to accurately capture recurring weekly cycles in traffic, such as drops or surges on weekends.
We require a minimum of 30 days of historical data to build a stable model. This model becomes our baseline for detecting abnormal changes.
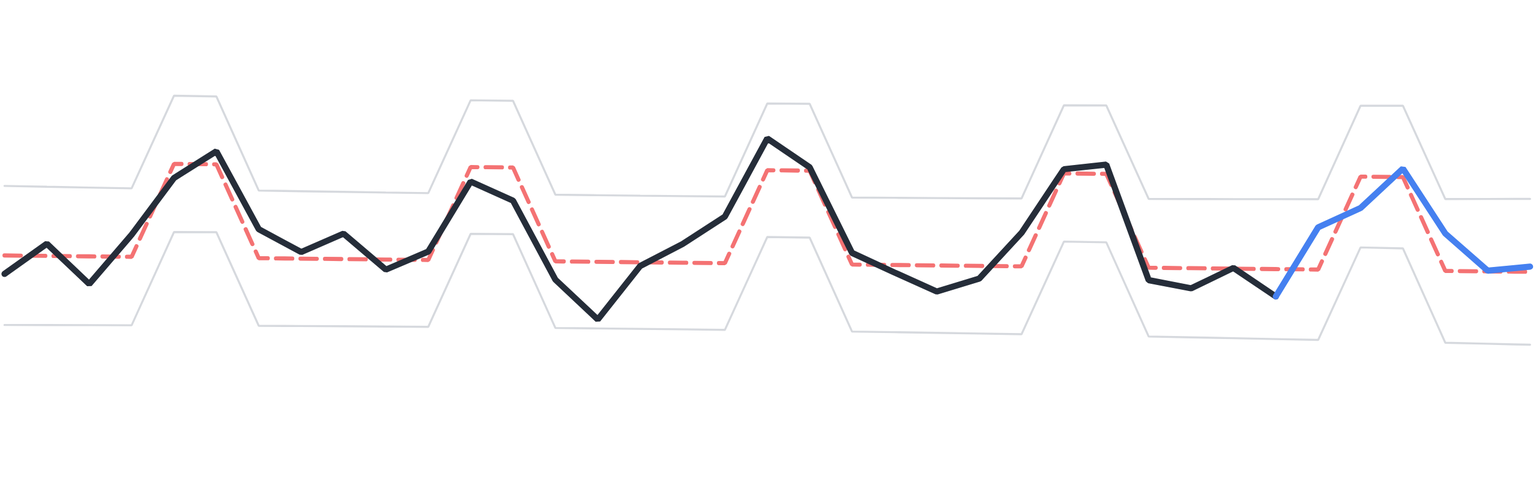
With the model trained, we generate predictions for the next 7 days, forming the expected trend.
For each day, we compute a 99% confidence interval around the predicted value. This represents the statistically expected range for each metric, accounting for both trend and variance.
Once the 7-day period has passed, we compare actual values to the predicted range.
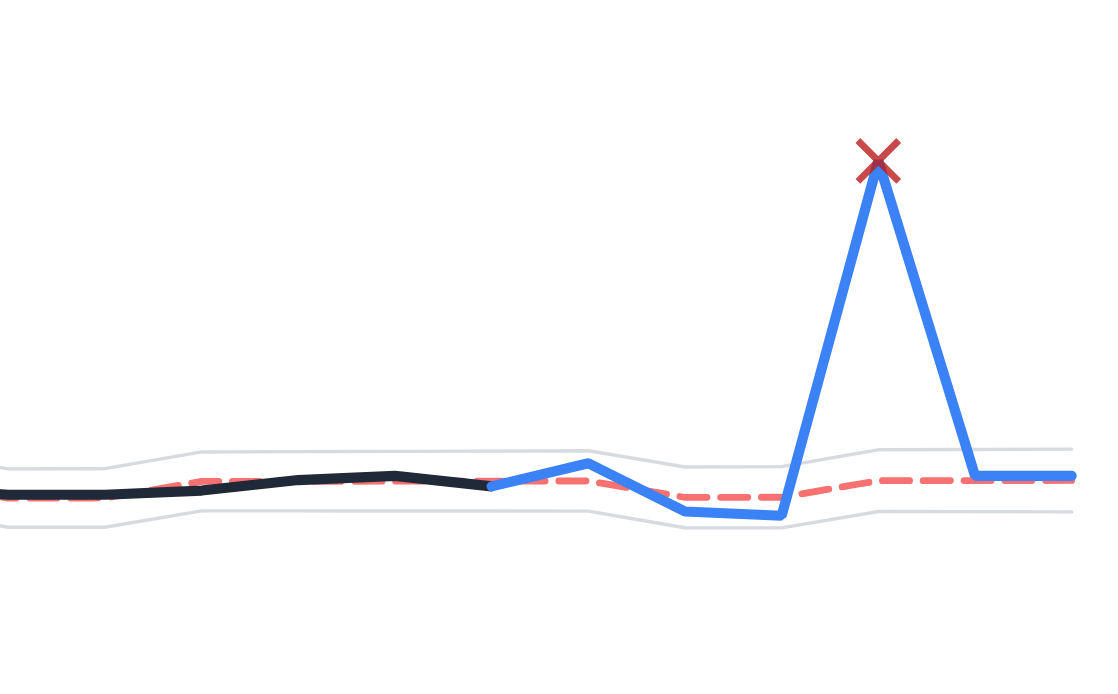
This gives you a weekly snapshot of unexpected behavior in your traffic, conversions, or search performance, without the need to look through multiple dashboards.
Each week, we generate a concise report summarizing what happened:
You’ll receive an email listing all metrics with detected anomalies, along with a link to your personalized web dashboard.
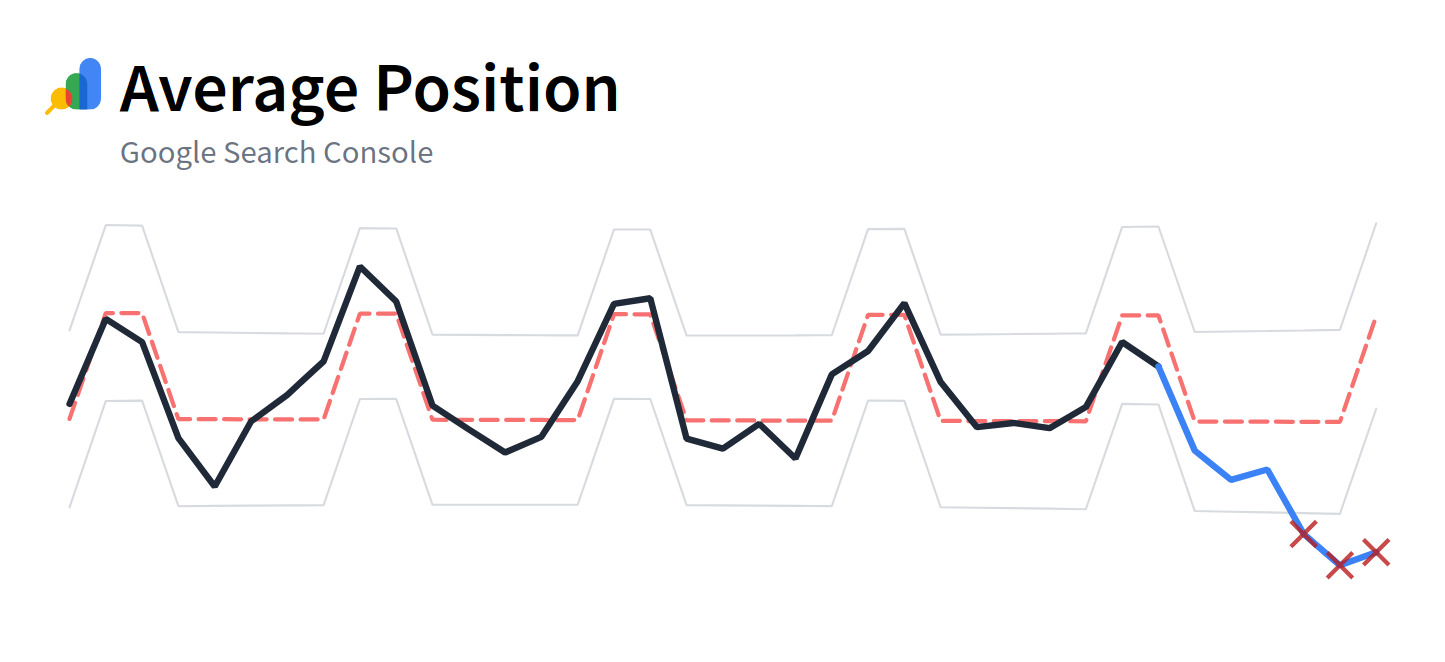
The dashboard contains a 37-day plot for each metric (30 days of training + the last 7 days of monitoring).
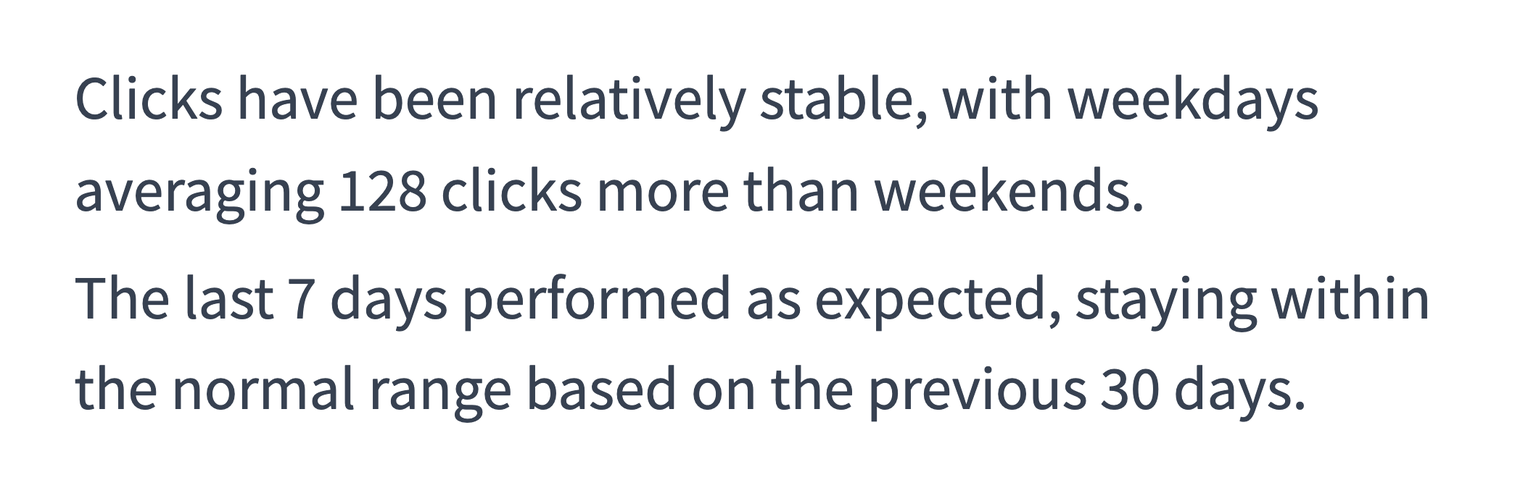
Below the graph we generate a paragraph explaining the trend, the differences between weekends and weekdays and whether there were any outliers. We found that having a simple explanation is really useful if you aren't a stats expert. But also just to give you a better intuition of the data.
Here is an example of such a text:
For each metric, we also show:
Each WebTrafficWatch account can currently connect:
From those accounts, we can import multiple domains and properties, and you can choose which metrics to track per property. The modeling and reporting process runs independently for each metric.
Because we only use daily aggregates, the platform scales effortlessly across both low- and high-traffic sites. Whether your site gets 100 visitors or 1 million, the performance and accuracy remain consistent.
WebTrafficWatch acts like a lightweight data science layer on top of your existing analytics stack. It’s designed to answer a simple question:
"Did something unusual happen last week?"
And it answers that with as much statistical rigor as possible, without requiring you to open a spreadsheet or run complex Python scripts.
Whether you're monitoring a product launch, tracking SEO efforts, or just want peace of mind that your traffic is behaving normally, WebTrafficWatch gives you the signal, without the noise.
